in Astronomical Data Analysis Software and Systems III, A.S.P. Conference Series, Vol. 61, 1994, Dennis R. Crabtree, R.J. Hanisch, and Jeannette Barnes, eds., p. 191.
Abstract
The information contained in the two CDROMs of the Hubble Space Telescope Guide Star Catalog has been condensed into a series of all-sky maps. The magnitudes of Guide Stars of the northern and southern hemispheres, which were taken on different types of plates have been calibrated to produce a statistically accurate V-filter flux map of the Milky Way galaxy. Individual object fluxes cannot be calibrated accurately, but by using a large number (16,000 for the first pass, 180,000 for the second) of sources near the equator which were measured on both Palomar and SERC plates, an average calibration can be fit. An intermediate step in the calibration produced a catalog of 180,524 objects in the GSC for which measurements at two colors exist. A catalog binning program, SKYPIC, developed from SKYMAP was used to produce two-dimensional FITS images from the Guide Star Catalog. Maps of source density, as well as flux maps of sources flagged as non-stellar, show excesses at the edges of plates.
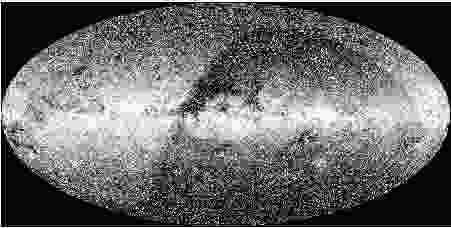
Each sky position was then projected into an image array. For all-sky maps, the Aitoff projection was used, using the same algorithm algorithm as the IRAS All-Sky survey plates (IRAS Explanatory Supplement 1988). For the first pass, a 30-arcminute pixel size was used, giving an image with 720 pixels in longitude and 360 pixels in latitude. Positions and magnitudes for selected sources were read from the Guide Star Catalog CDROMs. For objects with multiple entries, error-weighted mean positions and magnitudes were used. The image levels are scaled so that the faintest star gives one count. For the first attempt, all magnitudes were assumed to be at the same bandpass. Figure 1 shows the result, scaled using SAOIMAGE's histogram method to bring out low flux levels without diminishing bright pixels. The brightness demarcation at the equator shows that magnitudes from the SERC-J plates in the Southern Hemisphere do not mean the same thing as those on the PAL-V Northern Hemisphere plates.
| Aitoff projection of HST Guide Star Catalog flux in 30-minute bins with no magnitude recalibration |
|
| Polynomial fit of UK SERC Schmidt J magnitudes to Palomar Quick V magnitudes for 97,927 Guide Star Catalog sources appearing on both types of plates |
|
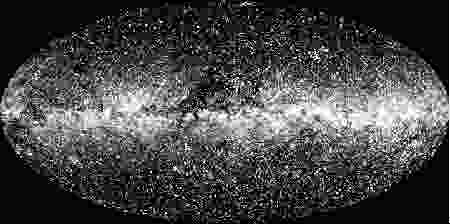
| Aitoff projection of HST Guide Star Catalog flux in 15-minute bins with magnitude recalibration |
|
Figure 3 shows the calibrated image with 15-arcminute bins bringing out more structural detail. Note that there is some faint structure following plate edges. This excess flux may be due to unidentified duplication of sources due to errors in astrometry near plate edges.
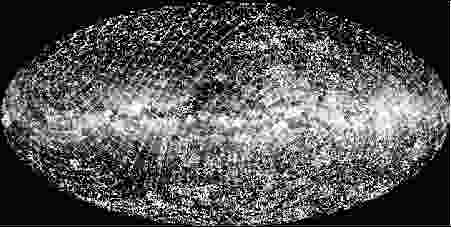
| Aitoff projection of HST Guide Star Catalog flux from non-stellar objects in 15-minute bins with magnitude recalibration |
|
Figure 4 shows only sources flagged as non-stellar in the Guide Star Catalog. The structure is more pronounced, indicating that there is more flux from nonstellar sources in plate overlap regions, especially in the northern hemisphere (on the upper left). Fuzzy images at plate edges may cause an excess number of nonstellar sources. There may be multiple entries for the same sources due to bad plate solutions near the edges of Schmidt plates.