Creating Data that Never Die:
Building a Spectrograph Data Pipeline in the Virtual Observatory Era
by
Douglas J. Mink, William F. Wyatt, John B. Roll, Susan P. Tokarz,
Maureen A. Conroy, Nelson Caldwell, Michael J. Kurtz, Margaret J. Geller}
Smithsonian Astropysical Observatory
Paper P1.1.15 presented at ADASS XIV, Pasadena, California, October 25, 2004
Abstract
Data pipelines for modern complex astronomical instruments do not begin when
the data is taken and end when it is delivered to the user. Information must
flow between the observatory and the observer from the time a project is
conceived and between the observatory and the world well past the time
when the original observers have extracted all the information they want
from the data. For the 300-fiber Hectospec low dispersion spectrograph
on the MMT, the SAO Telescope Data Center is constructing a data pipeline
which provides assistance from preparing and submitting observing proposals
through observation, reduction, and analysis to publication and an afterlife
in the Virtual Observatory. We will describe our semi-automatic pipeline
and how it has evolved over the first nine months of operation.
Introduction
Hectospec (Fabricant et al 1998) is a 300-fiber spectrograph which takes
advantage of the 1-degree
field available on the 6.7-meter MMT telescope on Mt. Hopkins in Arizona.
The fibers are positioned
by robots, so the entire observing process takes place under computer control.
In this paper, we look at the entire life cycle of an observation made by
the Hectospec, enlarging the concept of a "pipeline" to include all of the
processes from the time an astronomer gets an idea for a scientific observation
to the permanent archiving of the data in a way which is accessible to the
world. This process is not a closed system, and in the era of the world-wide
Virtual Observatory, connects to database and archives outside of our
observatory at many points. Figure 1 shows the flow of data from the mind
of the astronomer to its resting place in the Virtual Observatory.
Figure 1. Hectospec Pipeline
Preparing to Create Data
Complete information about the Hectospec is available online, including
the full "Hectospec Observers Reference Manual" (Fabricant and Caldwell 2004).
This instrument needs object positions accurate to 0.25 arcsecond, and most
recent large catalogs, such ast the USNO-B1.0, 2MASS PSC, GSC II, and UCAC2,
are adequate (Mink et al 2003). Good positions for uncatalogued objects
can be taken from images which are aligned with any of these catalogs using
the WCSTools software (Mink 1996), which can access the catalogs locally
or over the Internet.
Application for time on the Hectospec is entirely Web-based, including
voting by the Time Allocation Committee, using Perl software based on that
used by NOAO (Gasson and Bell 2002). Abstracts and metadata submitted
in this process remain attached to data taken via the program numbers
assigned by the TAC when the telescope schedule is put online. The
schedules are archived, as are the abstracts and metadata.
An astronomer with time allocated on the Hectospec must set up fiber
positions using an interactive program (Roll et all 1998). Sky positions
and guide stars are found automatically using one of the large all-sky
catalogs mentioned above. Multiple exposures are often needed to get
spectra of all of the program objects in a field. Since the exact
time of the observation is not known by the astronomer, final fiber
assignments are made the night of the observation by the telescope staff
so that exact circumstances, such as differential refraction across the
focal plane, can be taken into account.
Taking Data
In addition to the bias and dark frames, flat field images are taken of a
white field on the telescope dome (to find out where the spectra are on
the image) and the sky (to calibrate fiber throughput).
The spectrograph, which is in a separate temperature-controlled room from
the telescope is stable enough that a single set of calibration lamp
spectra works for an entire night. Each field is exposed at least
three times so that cosmic rays can be eliminated without damaging
similar-looking emission lines in the spectra. Each of the two CCDs
of the detector is read out through two amplifiers, and the four images
which are created are stored in multi-extension FITS files along with
the fiber position maps as FITS table extensions. The data is immediately
transferred from Arizona to Cambridge, Massachusetts, where processing
and archiving takes place. Figure 2 shows examples of the three major
kinds of images.
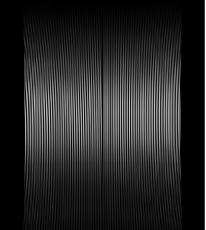
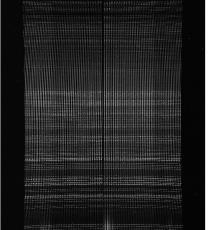
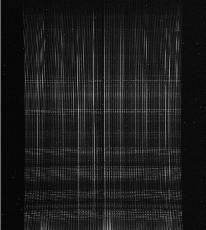
Figure 2. Hectospec dome flat spectra, used as aperture mask,
calibration lamp spectra, showing staggered fibers, and object spectra,
dominated by night sky emission lines
Reducing Data
Hectospec data is reduced using the image processing and fiber extraction
features of IRAF, controlled by locally-written IRAF CL scripts. We have
found that a modular system has made it easy to update processing techniques
as we have found ways to improve them.
After combining the multiple images of a single pointing to eliminate
cosmic rays and merging the amplifiers, spectra are extracted into individual
files using a
variation on the IRAF dofibers task. Wavelength calibration is more complex
than normal because the fibers are alternately staggered which allows them
to be closer packed. Throughput calibration is very important, so that
sky background spectra from one fiber can be subtracted from image
plus sky spectra in another fiber. This requires both careful calibration
and fine-tuning by scaling night sky emission lines individually for each
fiber before subtracting the background. The object, sky, and object + sky
spectra are saved in IRAF Multispec FITS files.
As part of our reduction pipeline, we compute redshifts for each object
spectrum using our own XCSAO program (Kurtz \& Mink 1998). The results
are written into the image header of each object spectrum file. All of
the reduction software is available as IRAF, ksh, and C software.
Archiving and Distributing Data
The raw data, reduced data in a single IRAF Multispec FITS file per pointing,
and reduced data as one background-subtracted IRAF Multispec FITS file per
fiber are archived. Investigators are given access to all versions of their
data. As scientific papers which use the data are published, that data
will be moved into a public archive, where it will be accessible both through
our instrument web site, searchable by sky position, and through the
Astrophysical Data System, accessible by observing program.
Conclusions
The Virtual Observatory is a tool as well as an archive. Data published
on the VO can not only be used in its own right, but can point toward data
needed to fill gaps. Catalogs available through the VO can be used to
calibrate images and suggest blank areas of sky for background removal
as well as suggest positions to observe. Data which is destined to be
shared via the Virtual Observatory must be well-documented. Not only
information about the hardware used to obtain the data, but also the
processing which it undergoes must be linked in some way to the data.
Knowledge of the process from proposal to archive should be maintained.
Every process which changes the data must leave some description of what
it has done. Not just keywords, but their meanings must be accessible
to future users of the data.
References
- Fabricant, D. G., Hertz, E. N., Szentgyorgyi, A. H., Fata, R. G., Roll, J. B.,
Zajac, J. M. 1998, in Optical Astronomical Instrumentation, ed. Sandro
D'Odorico Proc. SPIE Vol. 3355, 285
- Gasson, D., & Bell, D. 2002, in ASP Conf. Ser., Vol. 281, ADASS XI, ed. D. A.
Bohlender, D. Durand, & T. H. Handley (San Francisco: ASP), 457
- Kurtz, Michael J., & Mink, Douglas J. 1998, PASP, 110, 934
Mink, D. J. 1996, in ASP Conf. Ser., Vol. 125, ADASS VI, ed. G. Hunt &
H. E. Payne (San Francisco: ASP), 249
- Mink, D. J., Brown, W. R., Kurtz, M. J. 2003 in ASP Conf. Ser., Vol. 314,
ADASS XII, ed. F. Ochsenbein, M. Allen, & D. Egret (San Francisco:ASP), 141
- Roll, J. B., Fabricant, D. G., McLeod, B. A. 1998, in Optical Astronomical
Instrumentation, ed. Sandro D'Odorico Proc. SPIE Vol. 3355, 324
[PDF paper]
[PDF poster]
[web presentation]