
|
SAOimage Color Table Manipulation |

|
|
|
SAOimage Color Table Manipulation |
|
| gray | black body | HEA | IMP 8 | A | B |
| 
| 
| 
| 
| 
|
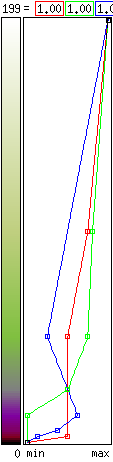
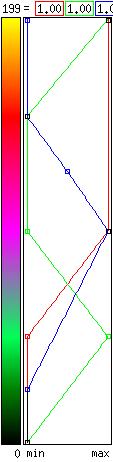
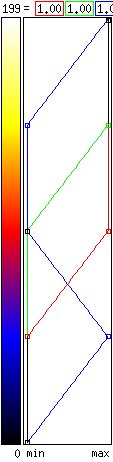
With threshold/saturation, moving the mouse horizontally moves the lower (threshold) end of the graph up or down, while moving the mouse vertically moves the upper (saturation) end of the graph up and down relative to the palette. With contrast/bias, moving the mouse along the axis of the color bar shifts the entire graph up or down (bias) relative to the palette, while moving the mouse perpendicular to the color bar moves the ends of the graph closer together or farther apart about a middle position (contrast). Threshold/saturation is easy to implement in software and common in pseudocolor display systems. Contrast/bias corresponds more closely to the kinds of adjustments familiar to photographers. In both cases, the middle of the display window is the default graph position relative to the palette.
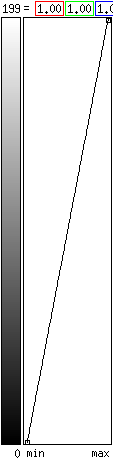
The intensities of the colors are normally given relative to voltage applied to the color guns in the monitor. Half intensity is half of full voltage. Unfortunately, this does not really correspond to the sensitivity of the eye. Double the voltage does not seem like doubling the intensity. Half voltage on a gray scale does not seem like a middle gray. The gray scale seems to favor the darker shades. The relationship between voltage and perception is generally thought to be an exponential one and is represented by the symbol small gamma. Changing the gamma produces a non-linear (exponential) adjustment in contrast. A gamma of between 2 and 2.2 is considered correct for a typical monitor. You can play with the gamma adjustment by selecting the "power" mode in the "Color" submenu. Moving the mouse horizontally in the main display window with a mouse button down adjusts the gamma. The gamma values for each color are printed beside the color graph. Gamma of 1 (linear) is in the middle of the main window. The intensity adjustment is applied directly to the palette colors and does not affect the points used to map the colors. Gamma values below 1 may be useful for sharpening the contrast before making a hard copy. You can drag beyond the main window for gamma values outside the normal range.
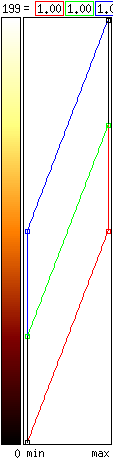
Normally, all adjustments are applied equally to each of the three colors. However, the adjustments can be applied to any one or two of the colors by holding down the control key. Then the three mouse buttons control red, green, and blue, respectively, as in the graph window.
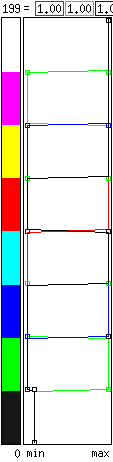
The "invert" button in the "Color" submenu inverts the intensities (minimum intensity becomes maximum intensity) without changing the graph points.