xcsao
Example 2.
Emission and Absorption
In this example, we illustrate the variety of
printed reports and
graphical summaries available from
xcsao. These can be used to get a feeling for the quality of the
resulting redshift and to pass on xcsao results for use by other
programs.
|
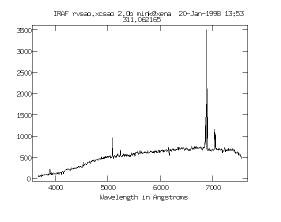
To obtain the redshift of a single galaxy, we will cross-correlate this
one-dimensional spectrum, found in an IRAF multispec file named
1995.1122.0113.311.062165.ms.imh, against three template spectra.
The parameters are set in
xcsao.par.
|
|
|
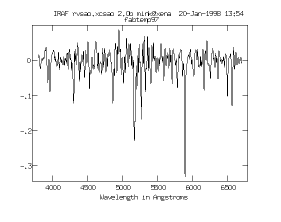
The emission line template spectrum has been
synthesized based on line positions from a wavelength table and mean widths
from many emission line spectra taken by this instrument.
|
|
Running xcsao
cl> xcsao 1995.1122.0113.311.062165.ms.imh
returns the following output if
report_mode = 1:
IRAF rvsao.xcsao 2.0b mink@xena Thu 12:14:58 10-Jul-97

1995.1122.0113.311.062165.ms Object: 311.062165
RA: 08:13:29.34 Dec: 29:02:12.0 $.1f23-Nov-1995 10:37:37.00 =HJD2450044.9457 BCV:  25.30
3679.9A- 7551.7A 4096 points, filter: 5 20 125 250 apodize 0.05 fit 0.5 best 1
Temp:          femtemp vel:   0.00  tsh:   0.00 HCV:   0.00 Peak: 14415.3 h:0.950 R:  52.48 CZ: 14441.8 +/-  11.655 1 +tc
Temp:       fn7331temp vel: 796.90  tsh:   0.00 HCV:   0.00 Peak: 13564.6 h:0.507 R:   7.29 CZ: 14424.1 +/-  38.929 1 -el
Temp:            ztemp vel:   0.00  tsh:   0.00 HCV:   0.00 Peak: 14406.9 h:0.479 R:   6.67 CZ: 14433.4 +/-  26.785 1 -el -tf +tc
Interacting with the Summary Display
If curmode is yes, the user can
change the final display to discover more about the results.
|
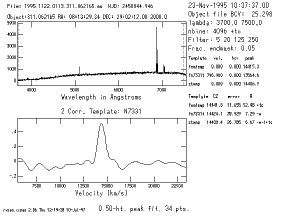
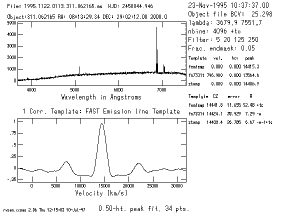
Using the t command, the user can replot the summary page with a
different template's cross-correlation. While the best match,
template spectrum 1, is an
artifically-created emission line template spectrum, the cross-correlation with
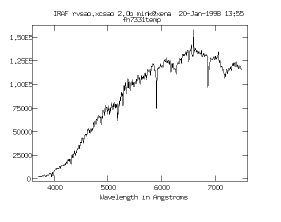
template spectrum 2, a composite
spectrum of a galaxy exhibiting absorption lines
|
|
|
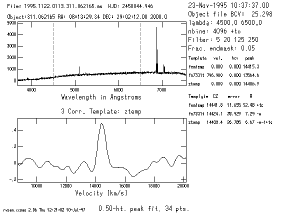
and the cross-correlation with
template spectrum 3, a composite
template spectrum made from the spectra of several different galaxies.
The shorter portion of the spectrum it covers is demarcated by the dashed
lines in the summary page spectrum.
|
|
|
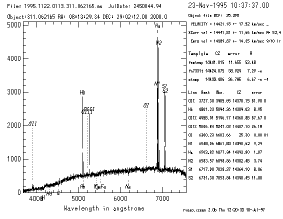
After the command l (for lines) is typed, the spectrum is
replotted with emission and
absorption lines labelled at the velocity labelled by the asterisk (*).
|
|
|
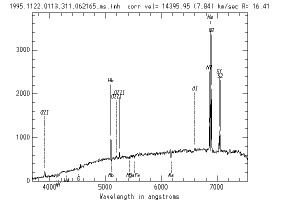
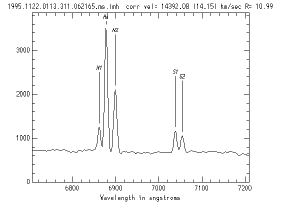
The / command will expand the spectrum graph to cover the entire
width of the display, with redshift velocity, error, and R-value displayed
at the top and the lines still labelled. This display is also useful if you
just want to have a graph of a spectrum with labelled lines. The o
command can be used to label
emission lines or
absorption lines or
both.
|
|
[xcsao]
[xcsao examples]





 .
.