xcsao
Example 1.
Cross-correlating a Galaxy Spectrum
In this example, we will demonstrate the variety of intermediate
graphical and
printed information available
when running xcsao. This may help the user to better understand
how the task computes a redshift.
|
We will obtain a redshift from the
spectrum of a galaxy
with absorption features and
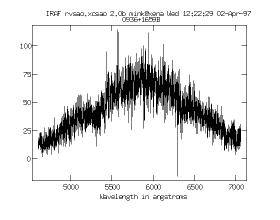
Start with this image and click on [next]
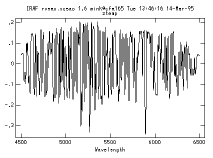
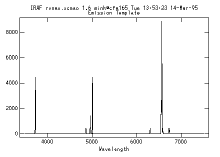
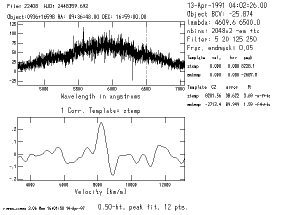
on each page to see all of the graphical displays xcsao produces for
this example if the proper parameters are set. Click on
[graphs] to select from a page
of thumbnail images of all of the possible graphs which xcsao can
generate in the course of processing this example.
|

|
The command
cl> xcsao 22408 templates=ztemp,stemp
runs the task, and may, if switches are set, plot
many intermediate graphs.
If debug=yes, a lot of stuff is also
sent to standard output (usually the terminal).
The results are printed to the files listed in the parameter
logfiles:
22408 Object: 0936+1659B
RA: 09:36:48.00 Dec: 16:59:00.0 1950.0
1991-Apr-13 04:02:26.00 =HJD2448359.6920 BCV: -25.87
4609.6A- 6500.0A 2048x2 points, filter: 5 20 125 250 apodize 0.05 fit 0.5 best 1
Temp:        ztemp.imh vel:   0.00  tsh:   0.00 HCV:   0.00 Peak: 8228.15 h:0.254 R:   3.69 CZ: 8201.56 +/-  38.622 1 -el -tf +tc
Temp:       emtemp.imh vel:   0.00  tsh:   0.00 HCV:   0.00 Peak: -2687.8 h:0.060 R:   1.59 CZ: -2713.4 +/-  89.949 1 +hi -tf +tc
[xcsao]
[xcsao examples]
[xcsao example 2]


