PICNIC Noise Analysis Plots
A. PICNIC/VxWorks Before Ground Improvements
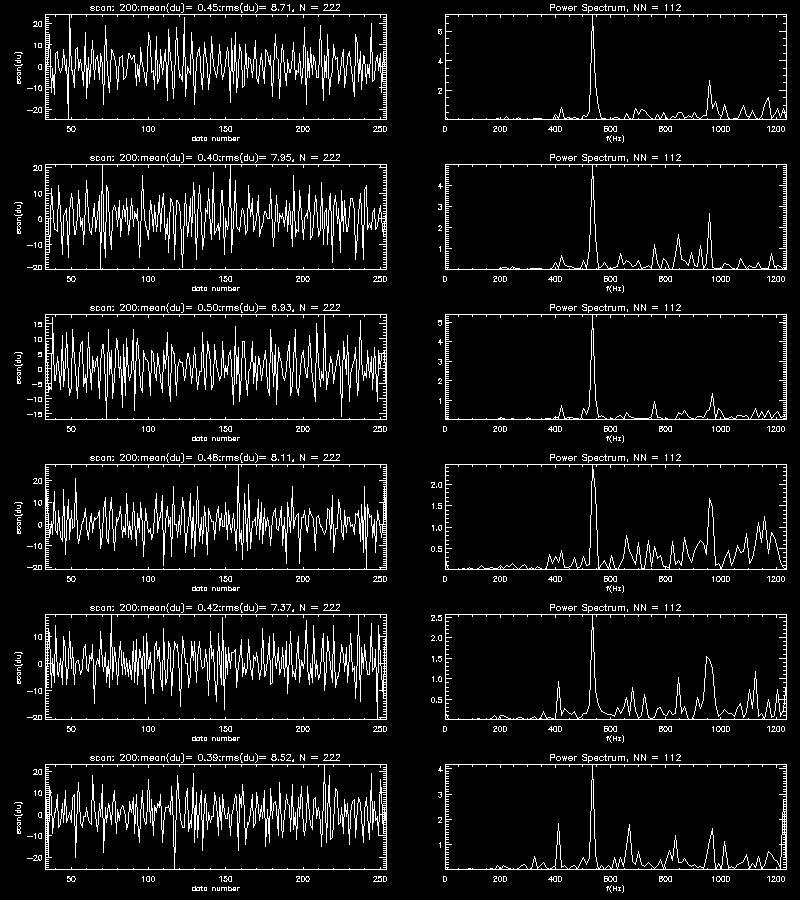
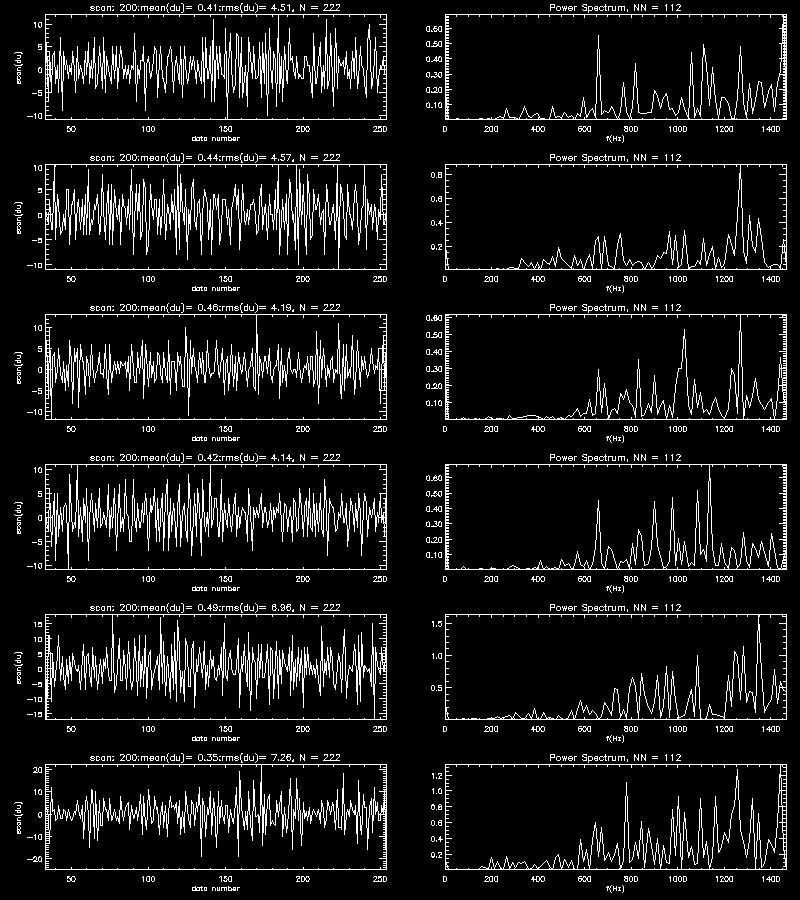
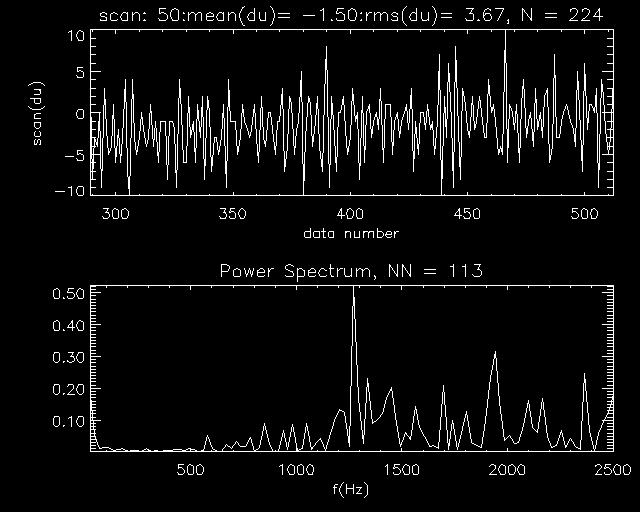
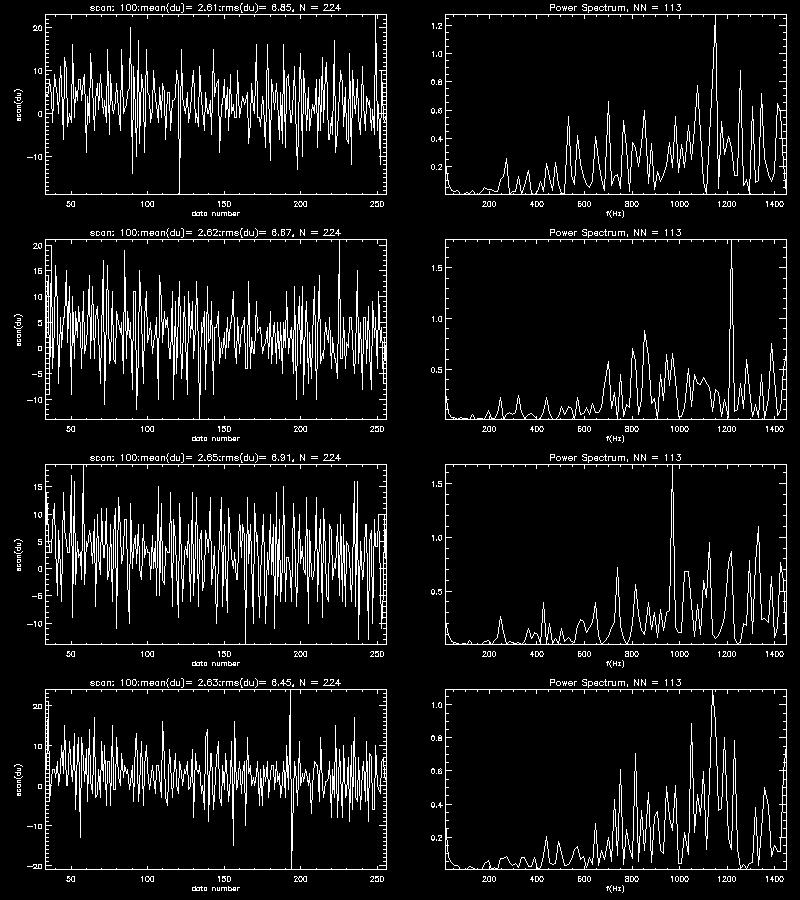
A.1. Typical scans and power spectra (linear scale), 6 pixels
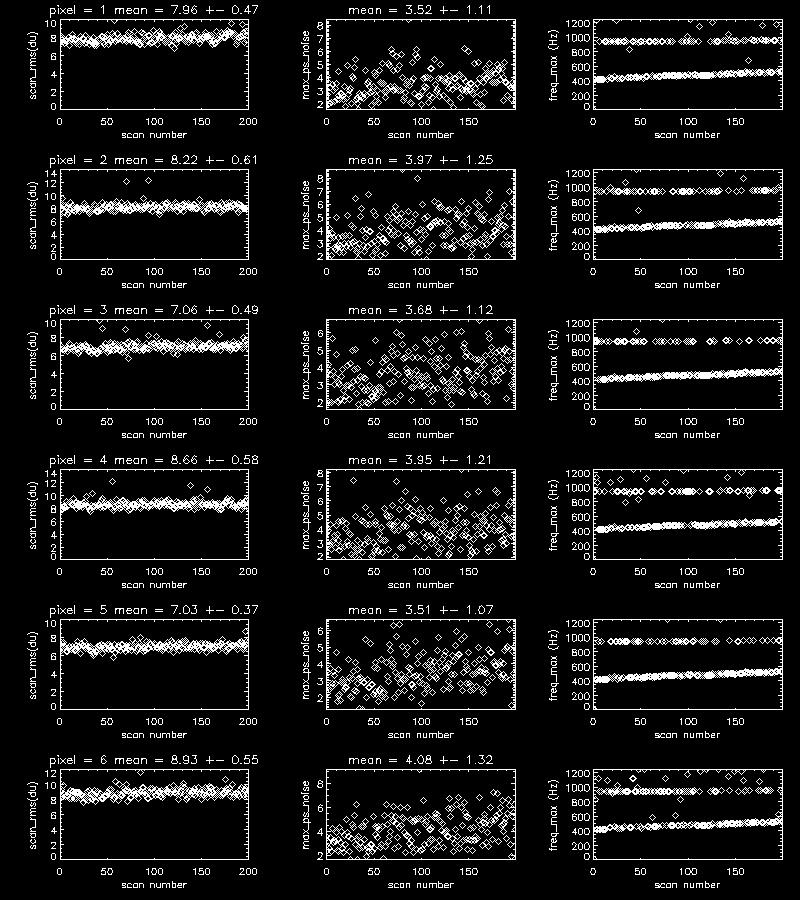
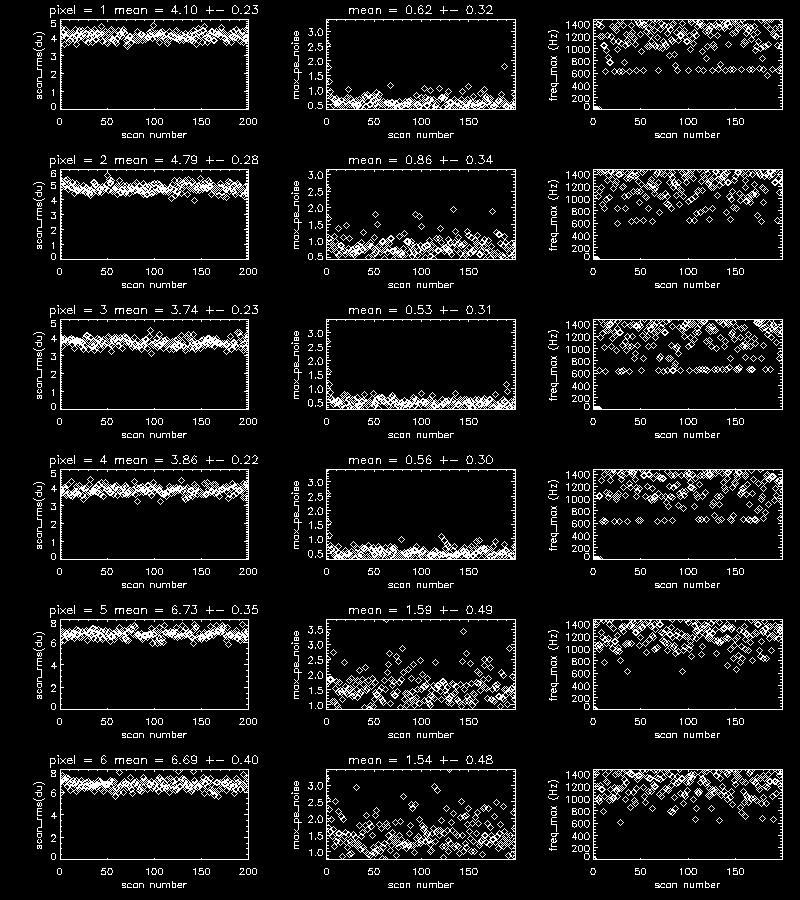
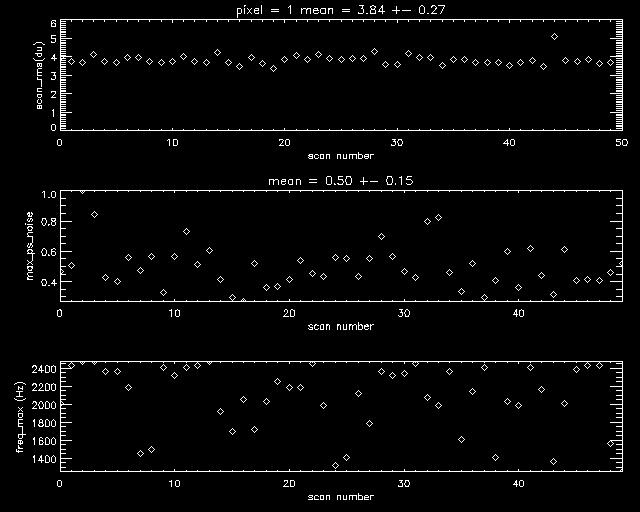
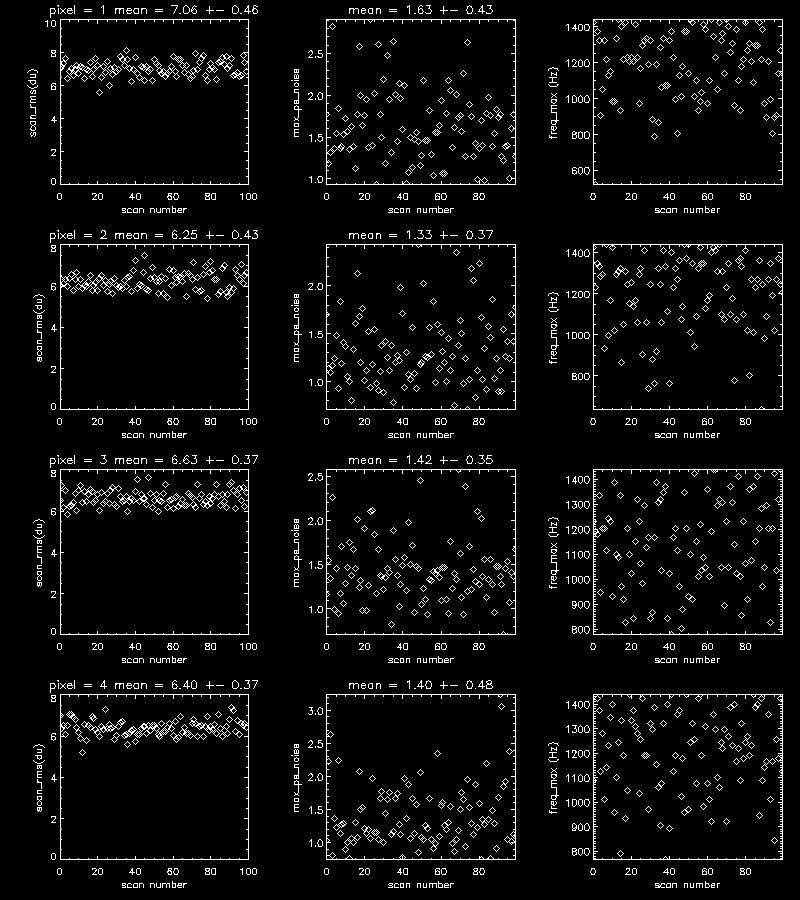
A.2. Scan_rms, max power spectrum noise and corresponding frequency, for
each scan
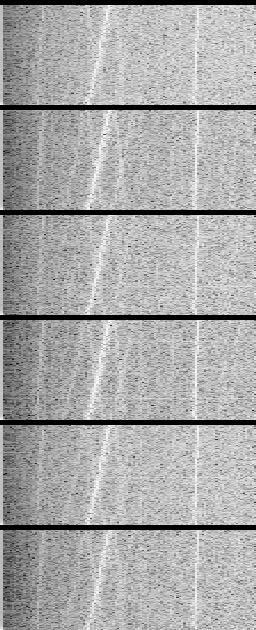
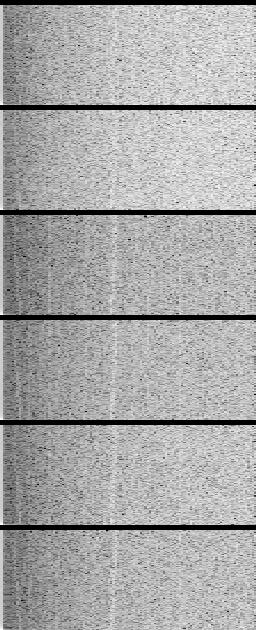
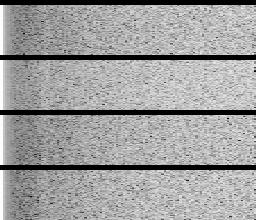
A.3. Scans cascade plots for each pixel (log scale, top is last pixel)
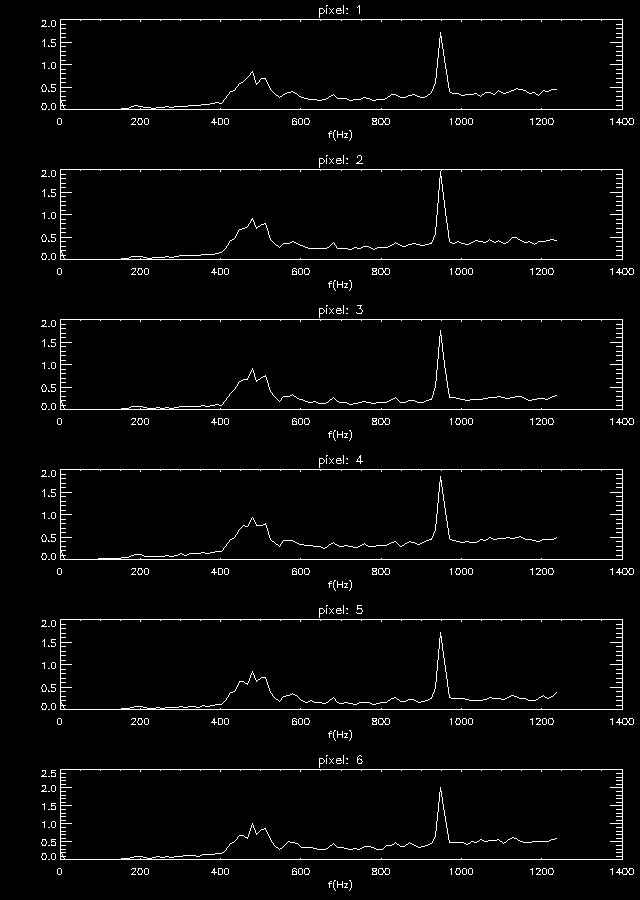
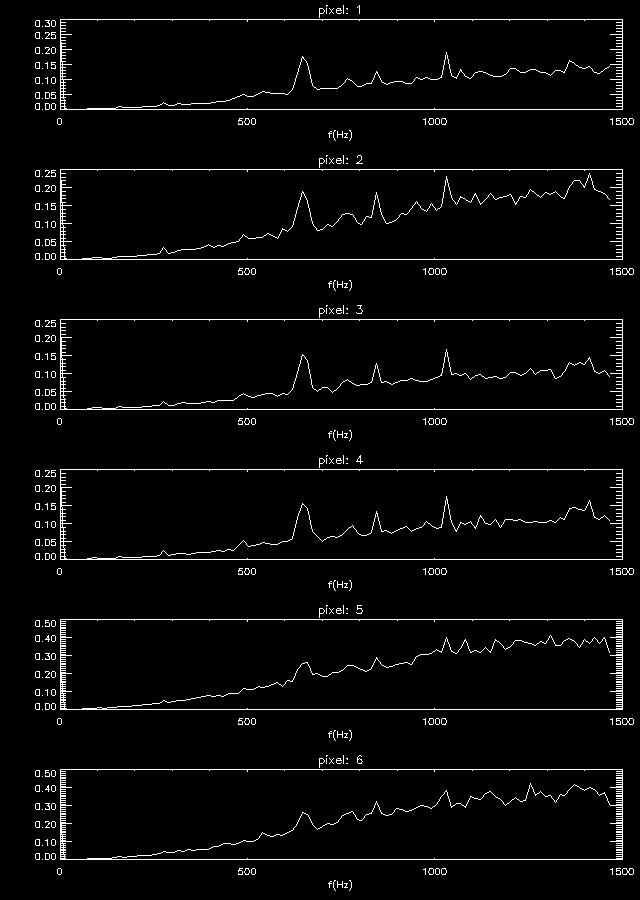
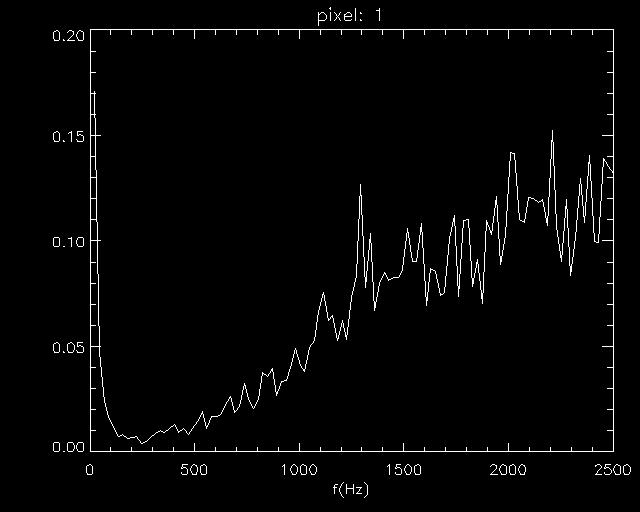
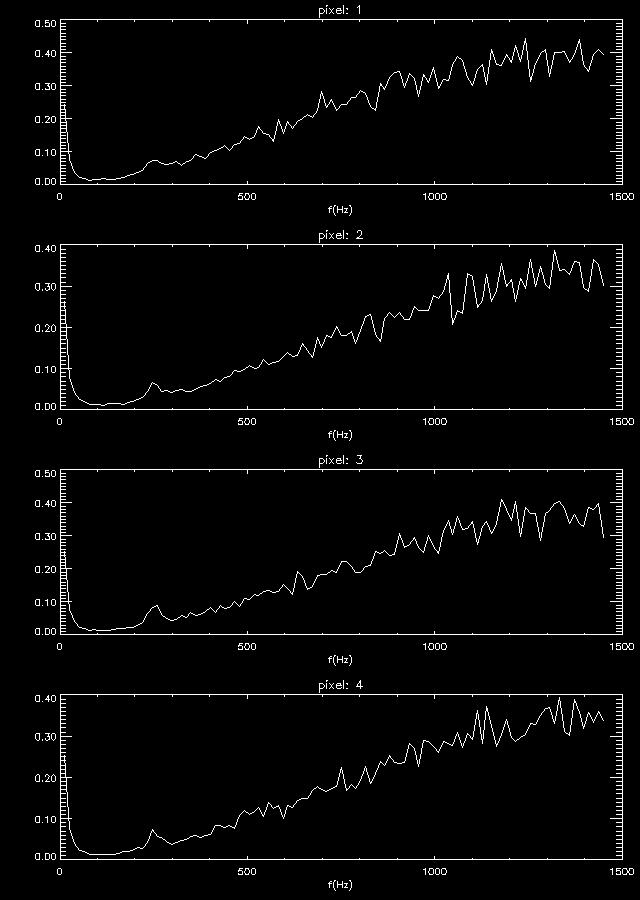
A.4. Average power spectra (linear scale)
B. PICNIC/VxWorks After Ground Improvements
B.1. Typical scans and power spectra (linear scale), 6 pixels
B.2. Max power spectrum noise and corresponding frequency, for
each scan
B.3. Scans cascade plots for each pixel (log scale)
B.4. Average power spectra (linear scale, top is last pixel)
C. PICNIC/Pentium
C.1. Typical scans and power spectra (linear scale), 1 pixel
C.2. Max power spectrum noise and corresponding frequency, for
each scan
C.3. Scans cascade plots for each pixel (log scale)

C.4. Average power spectra (linear scale)
D. NICMOS/Pentium (FLUOR data)
D.1. Typical scans and power spectra (linear scale), 4 pixels
D.2. Max power spectrum noise and corresponding frequency, for
each scan
D.3. Scans cascade plots for each pixel (log scale)
D.4. Average power spectra (linear scale)
Rafael Millan-Gabet
rmillan@cfa.harvard.edu
May 02